
Certainly, here is an overview of the growth of the U.S. national debt over the past 20 years, based on official data from the U.S. Treasury and the Congressional Budget Office (CBO):
U.S. National Debt: 2005–2025
| Year | Total Federal Debt (USD Trillions) | Debt-to-GDP Ratio (%) |
|---|---|---|
| 2005 | 7.9 | 61.7 |
| 2008 | 10.0 | 67.7 |
| 2010 | 13.6 | 91.0 |
| 2015 | 18.1 | 100.3 |
| 2020 | 26.9 | 128.0 |
| 2023 | 33.1 | 129.0 |
| 2025 | 36.6 | ~135.0 |
Note: Figures for 2025 are estimates based on current data.
Key Drivers of Debt Growth
- 2008 Financial Crisis: The global financial meltdown led to significant government spending to stabilize the economy, increasing the debt substantially.
- COVID-19 Pandemic (2020): Emergency relief measures and stimulus packages to combat the economic impact of the pandemic resulted in a sharp rise in debt.
- Interest Payments: As of 2023, the annual cost of servicing the debt reached $726 billion, accounting for 14% of total federal spending.
Future Projections
The CBO projects that if current policies remain unchanged, the debt held by the public could rise from 99% of GDP in 2024 to 116% by 2034, and potentially reach 172% by 2054.
For detailed and up-to-date information, you can refer to official sources such as the U.S. Treasury’s Fiscal Data and the Congressional Budget Office.
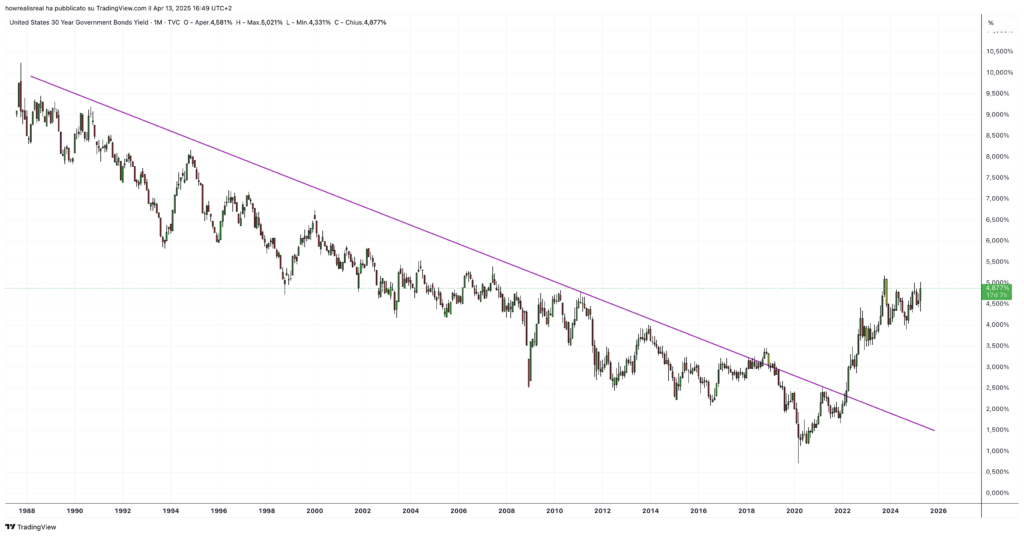
This image is a long-term yield chart of the United States 30-Year Treasury Bond (30Y T-Bond), displayed in a monthly timeframe.
- Time period: From the late 1980s to April 2025.
- Y-axis: Interest rate/yield (%), ranging from 0.0% to 10.5%.
- X-axis: Years, from approximately 1988 through 2025.
- Instrument: United States 30-Year Government Bonds Yield (TVC: US30Y)
Key insights from the chart
- Long-term downtrend (1988–2020)A clearly defined downward trendline (marked in purple) illustrates a multi-decade secular decline in long-term interest rates. From double-digit yields in the late ’80s, rates trended downward, reaching historic lows around 2020.
- Breakout from the trend (post-2020)Around 2022, the yield broke above the descending trendline, signaling a potential structural change in interest rate dynamics.
- Recent surge in yields (2022–2025)Since the breakout, yields spiked sharply, moving from sub-2% levels in 2020 to nearly 5% in 2024–2025, reflecting:
- Inflationary pressures post-COVID,
- Tighter monetary policy by the Federal Reserve,
- Possibly increased concerns about fiscal sustainability and rising debt levels.
- Current status (April 2025)The yield is approximately 4.88%, with recent highs just above 5%.
 Follow